Most local business owners open Instagram Insights or Facebook Business Suite, see a dashboard full of numbers, and close it. That’s a reasonable reaction. Ninety percent of what platforms show you is noise dressed up as data. For a service business trying to decide whether social media is earning its keep, only four numbers actually matter: saves and shares, profile taps, link clicks, and conversations started. Everything else is decoration.
This guide explains what each number tells you, how to find it, and what a reasonable target looks like for a local business in Orange County. If you want the short version: stop counting likes.
Which social media metrics actually matter?
The social media metrics that matter for a local business are the ones that predict a phone call, a booking, or a walk-in. That means saves and shares (proof someone found the post useful enough to keep), profile taps (proof they wanted to know who you are), link clicks (proof they moved toward your website), and conversations started through DMs, comments with real questions, or booking messages. Likes, reach, and follower count are context — not outcomes. A post with 40 likes and six saves usually outperforms one with 400 likes and zero saves, because saves indicate intent and likes indicate a thumb reflex.
If you’re new to reading platform dashboards, start with our companion piece on social media marketing for small businesses in Orange County, which walks through the setup side.
Number 1: Saves and shares
Saves and shares are the closest thing social platforms give you to a real signal of usefulness. A save means someone thought, “I want to come back to this.” A share means, “Someone I know needs to see this.” Both behaviors require more effort than a like, which is why the algorithms weight them heavily and why you should too.
For a local service business, saves and shares tend to concentrate on three types of content:
- Practical how-tos (“how to tell if your AC needs a recharge vs. a full service”)
- Local reference content (“the four best coffee shops within walking distance of our salon”)
- Before-and-after visuals with enough context to be genuinely informative
How to verify: on Instagram, tap a post → View Insights → look under “Interactions.” On Facebook, open the post inside Meta Business Suite and check the engagement breakdown. If a post has zero saves and zero shares, treat it as filler regardless of how many likes it earned.
Number 2: Profile taps

A profile tap is a person leaving the feed to look at your page. On Instagram, that number sits under “Profile activity” in the insights tab for each post. On Facebook and LinkedIn, it appears as page views attributed to a specific post.
This metric matters because it captures curiosity. Someone saw the post, wanted more context on who you are, and clicked. Owners often miss this number because it lives one layer deep in the dashboard, but it’s the bridge between passive scrolling and active interest. A local business posting three times a week should expect to see profile taps trend upward month over month if the content is doing its job. If taps are flat while reach is growing, the content is reaching people who don’t care — usually a targeting or format problem rather than a volume one.
Number 3: Link clicks
Link clicks are the cleanest revenue-adjacent signal social media gives a local business. Whether the link goes to your booking page, a service page, or a contact form, a click means someone chose to leave the platform for your site.
A few practical notes:
- Use one consistent bio link tool (or your own landing page) so you can track clicks in one place
- Put a clear reason to click in the caption — vague CTAs like “link in bio” without context underperform specific ones like “link in bio for our fall tune-up checklist”
- Cross-check platform-reported clicks against Google Analytics 4 sessions with a social source; the numbers rarely match exactly, and GA4 is usually the more conservative and useful figure
If your link clicks are trending up but your calls aren’t, the problem has moved off social and onto your website. That’s usually where a free website audit is more useful than more posting.
Number 4: Conversations started

The fourth number is the one platforms don’t summarize well: real conversations. This includes direct messages that ask a genuine question, comments requesting information (“do you service Costa Mesa?”), and booking-adjacent replies. You have to count these manually or with a simple tracker — a note in your phone works.
For most local service businesses, a single meaningful DM is worth more than a hundred likes. It’s a warm lead who already knows something about you and has raised their hand. Track the count each month, the source post if you can identify it, and whether the conversation converted into a call, quote, or booking. Over a quarter, this becomes the single most honest measure of whether social media is producing business.
What to ignore and why
A short list of numbers that look important and mostly aren’t:
- Follower count. Followers who never engage are a vanity metric. Local businesses often do more with 400 engaged local followers than 4,000 scattered ones.
- Reach and impressions in isolation. Useful as context, misleading as a KPI. High reach with low saves means the content traveled but didn’t land.
- Likes. Directional only. Never a goal.
- Post frequency streaks. Posting seven days a week with weak content trains the algorithm to show your posts to fewer people, not more.
If an agency’s monthly report leads with follower growth and impressions, ask what happened to saves, profile taps, link clicks, and conversations. That’s the test. The same discipline applies to paid social — for a broader take on why organic signals matter more than ever as ad costs rise, see our Southern California organic playbook.
What is a good engagement rate for a local business?
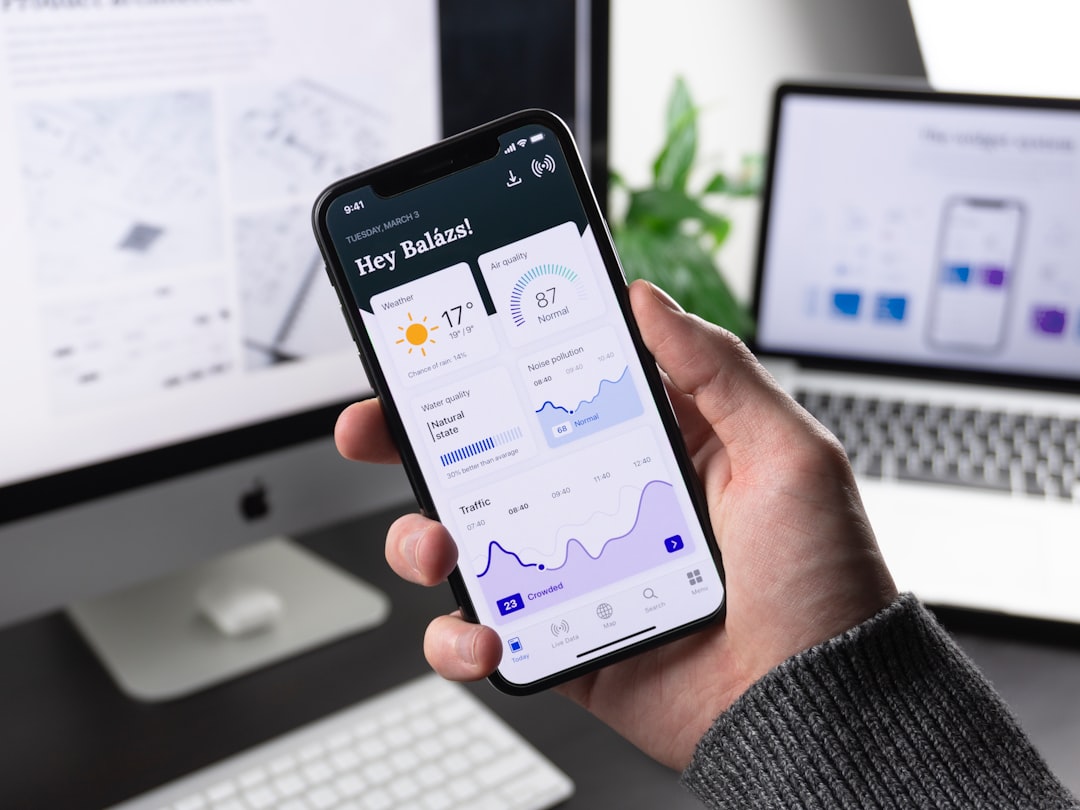
A reasonable social media engagement rate benchmark for a local service business on Instagram is 2% to 5% of reach, calculated as (likes + comments + saves + shares) ÷ reach. Facebook tends to run lower, often 1% to 3%, and LinkedIn for a service business owner personally posting sits in a similar 2% to 5% range. These are directional numbers, not guarantees. A dental practice in Huntington Beach with a small, local audience may see engagement rates well above 5% on specific posts because the audience is tightly relevant. A restaurant with broader reach may sit at 2% and still generate more walk-ins than a competitor at 6%. Rate matters less than whether the four numbers above are trending in the right direction over a quarter.
Your ten-minute monthly check
Once a month, set a timer for ten minutes and do this:
- Open each active platform’s insights for the past 30 days.
- Write down the totals for saves + shares, profile taps, and link clicks.
- Count the meaningful DMs and comment conversations from your notes or inbox.
- Identify your top post by saves + shares and your worst post by profile taps. Note what made each different.
- Decide one thing to do more of and one thing to stop.
That’s the whole review. It works because it forces attention onto behaviors that predict business rather than metrics that flatter the account. If you want a lightweight system for planning the posts themselves, our social media content calendar template pairs cleanly with this review.
Social media is one lever inside a broader local marketing system. If the four numbers are healthy but the phone still isn’t ringing, the bottleneck is usually search visibility or the website — which is where our local SEO service tends to move the needle faster. If you’d like a straight read on where your current social and search efforts stand, get in touch and we’ll take a look.
Photos by dlxmedia.hu, Jakub Żerdzicki, Patricia M. Lachance, Balázs Kétyi on Unsplash.